Calculator Online
 Sign In
Pages
Category
 AI Tools
 Health
 Math
Math Everyday Life
 Finance
 Physics
 Chemistry
 Statistics
 Construction
 Pets
Pets Time & Date
Follow Us On:
Calculator Online
Pages
Category
Follow Us On:
Enter your dataset, select whether it’s a sample or population, click "Calculate" to instantly see the standard deviation, variance, mean, sum, and error margin.
Related
This standard deviation calculator quickly finds how spread out numbers are in a dataset. It provides the mean, variance, coefficient of variation, standard error of the mean, and step-by-step calculations. Ideal for students, teachers, and professionals requiring fast, reliable results.
Standard deviation (σ) measures how much individual data points differ from the mean. It indicates how spread out your data is.
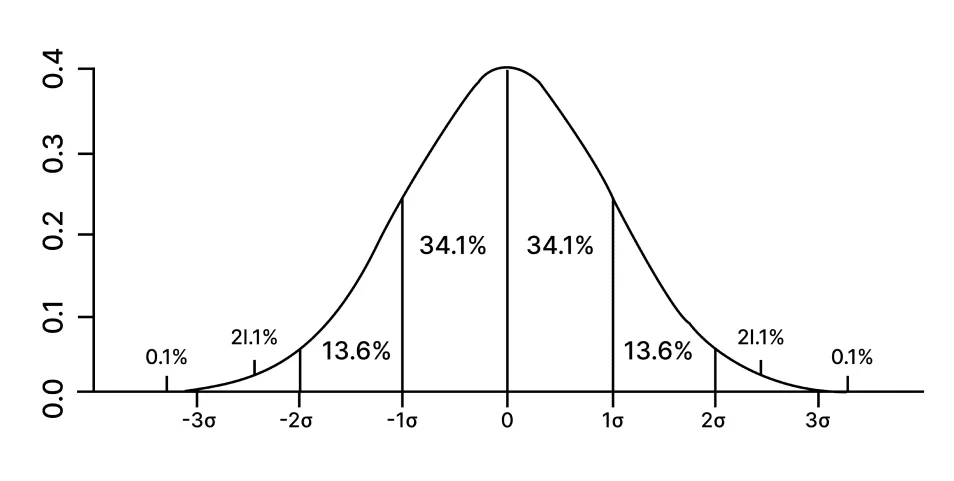
A low standard deviation indicates values are close to the mean, while a high standard deviation shows they are more widely spread. Applications include:
| Criterion | Sample Standard Deviation (s) | Population Standard Deviation (σ) |
|---|---|---|
| Formula | \(s = \sqrt{\dfrac{1}{n-1} \sum_{i=1}^{n} (x_i - \bar{x})^2}\) | \(σ = \sqrt{\dfrac{1}{N} \sum_{i=1}^{N} (x_i - \mu)^2}\) |
| Use Case | Subset of a population | Entire population data |
| Example | Test scores of 30 students in a class | Test scores of all students in a school |
| Bias Adjustment | Divide by n-1 to correct bias | Divide by N |
\(\sigma = \sqrt{\dfrac{1}{N} \sum_{i=1}^{N} (x_i - \mu)^2}\)
\(s = \sqrt{\dfrac{1}{n-1} \sum_{i=1}^{n} (x_i - \bar{x})^2}\)
Dataset: (3, 4, 9, 7, 2, 5)
Step 1: Mean: \(\bar{x} = 30/6 = 5\)
Step 2 & 3: Deviations & Squared Deviations
| Data (x_i) | x_i - x̄ | (x_i - x̄)² |
|---|---|---|
| 3 | -2 | 4 |
| 4 | -1 | 1 |
| 9 | 4 | 16 |
| 7 | 2 | 4 |
| 2 | -3 | 9 |
| 5 | 0 | 0 |
Sum of squared deviations = 34
Step 4: Variance
Sample: \(s^2 = 34/(6-1) = 6.8\)
Population: \(\sigma^2 = 34/6 = 5.67\)
Step 5: Standard Deviation
Sample: \(s = \sqrt{6.8} \approx 2.61\)
Population: \(\sigma = \sqrt{5.67} \approx 2.38\)
To understand variability, assess reliability, and check dataset consistency.
No. SD is always ≥ 0. Zero occurs only when all values are identical.
Sample: =STDEV.S(range)
Population: =STDEV.P(range)
Related
Add this calculator to your site.
×Just copy a given code & paste it right now into your website HTML (source) for suitable page.
Preview:


Easter into Action, Save With Satisfaction
UPTO
50 %
OFF
Give Us Your Feedback
Share Result
Standard Deviation Calculator

Links
Home Conversion Calculator About Calculator Online Blog Hire Us Knowledge Base Sitemap Sitemap TwoEmail us at
Contact Us© Copyrights 2026 by Calculator-Online.net