 Sign In
Pages
Category
 AI Tools
 Health
 Math
Math Everyday Life
 Finance
 Physics
 Chemistry
 Statistics
 Construction
 Pets
Pets Time & Date
Follow Us On:
Pages
Category
Follow Us On:
Input X and Y dataset values, and the calculator will readily compute their correlation coefficient using Pearson correlation or Spearman’s rank correlation technique.
Related
An online correlation coefficient calculator allows you to quickly determine the relationship strength between two sets of bivariate data. Many calculators provide both Pearson and Spearman methods along with graphical representations. Below, we explain how to compute correlation coefficients with examples and detailed steps.
Correlation measures the statistical association between two variables. It indicates whether the value of one variable can help predict the value of another. Correlation is a standardized version of covariance, ranging from -1 to 1. Note that correlation does not imply causation: a high correlation does not mean one variable causes the other to change. For independent variables, the correlation is zero.
Positive Correlation: Occurs when both variables move in the same direction — as one increases, the other tends to increase, and as one decreases, the other decreases.
Negative Correlation: Occurs when variables move in opposite directions — as one increases, the other tends to decrease.
Perfect Correlation: A perfect correlation allows exact prediction of one variable from the other. r = 1 indicates perfect positive correlation, while r = -1 indicates perfect negative correlation.
The correlation coefficient is a statistical measure quantifying the strength and direction of a linear relationship between two variables. It ranges from -1 to 1. A positive coefficient indicates a positive association, while a negative coefficient indicates an inverse relationship. The most commonly used metric is the Pearson correlation coefficient, denoted by ρ (rho) for populations or r for samples. It is calculated as the covariance of the variables divided by the product of their standard deviations:
ρ(X, Y) = cov(X, Y) / (σX * σY)
Pearson's r measures the linear association between two variables:
$$r = \dfrac{\sum{(x_i - \bar{x})(y_i - \bar{y})}}{\sqrt{\sum{(x_i - \bar{x})^2} \sum{(y_i - \bar{y})^2}}}$$
Given the datasets:
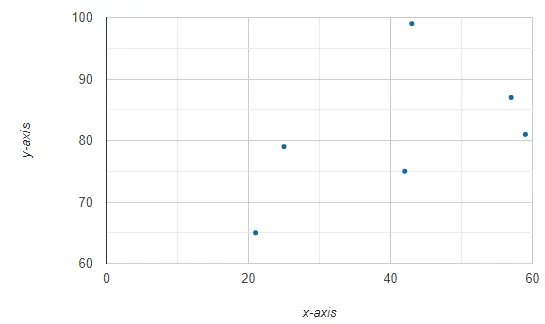
X = {43, 21, 25, 42, 57, 59}
Y = {99, 65, 79, 75, 87, 81}
Step 1: Number of samples, n = 6
Step 2: Compute the mean values:
μX = (43 + 21 + 25 + 42 + 57 + 59) / 6 ≈ 41.17
μY = (99 + 65 + 79 + 75 + 87 + 81) / 6 = 81
Step 3: Compute standard deviations:
σX ≈ 14.38
σY ≈ 10.46
Step 4: Compute the sum of the products of deviations:
∑(Xi - μX)(Yi - μY) ≈ 33
Step 5: Apply the Pearson formula:
r ≈ 0.529
Interpretation: r ≈ 0.529 indicates a moderate positive linear relationship. As X increases, Y tends to increase.
| (x_i - μ_X) | (x_i - μ_X)^2 | (y_i - μ_Y) | (y_i - μ_Y)^2 | (x_i - μ_X)(y_i - μ_Y) |
|---|---|---|---|---|
| 1.833 | 3.361 | 18 | 324 | 33 |
| -20.17 | 406.7 | -16 | 256 | 322.7 |
| -16.17 | 261.4 | -2 | 4 | 32.33 |
| 0.8333 | 0.6944 | -6 | 36 | -5 |
| 15.83 | 250.7 | 6 | 36 | 95 |
| 17.83 | 318 | 0 | 0 | 0 |
| Σ | 1240.83 | Σ | 656 | Σ |
An online correlation coefficient calculator can compute r and generate a scatterplot for better visualization. A covariance calculator can also assist in preliminary calculations: Covariance Calculator.
Pearson's r (also called PPMC) evaluates the strength and direction of linear relationships between continuous variables. ρ represents population correlation, r represents sample correlation.
Spearman's rank correlation evaluates monotonic relationships and is suitable for ordinal or non-linear data.
A monotonic association occurs when one variable consistently increases or decreases as the other changes.
Online correlation coefficient calculators simplify computing linear relationships and visualizing associations. Pearson's method remains the most widely used metric for analyzing continuous datasets.
Wikipedia: Pearson correlation coefficient
Investopedia: Correlation in statistics and investing
Statistics Solutions: Pearson, Kendall, and Spearman correlation
Related
Add this calculator to your site.
×Just copy a given code & paste it right now into your website HTML (source) for suitable page.
Preview:


Easter into Action, Save With Satisfaction
UPTO
50 %
OFF
Give Us Your Feedback
Share Result
Correlation Coefficient Calculator

Links
Home Conversion Calculator About Calculator Online Blog Hire Us Knowledge Base Sitemap Sitemap TwoEmail us at
Contact Us© Copyrights 2026 by Calculator-Online.net